Thesis Summary
Abstract
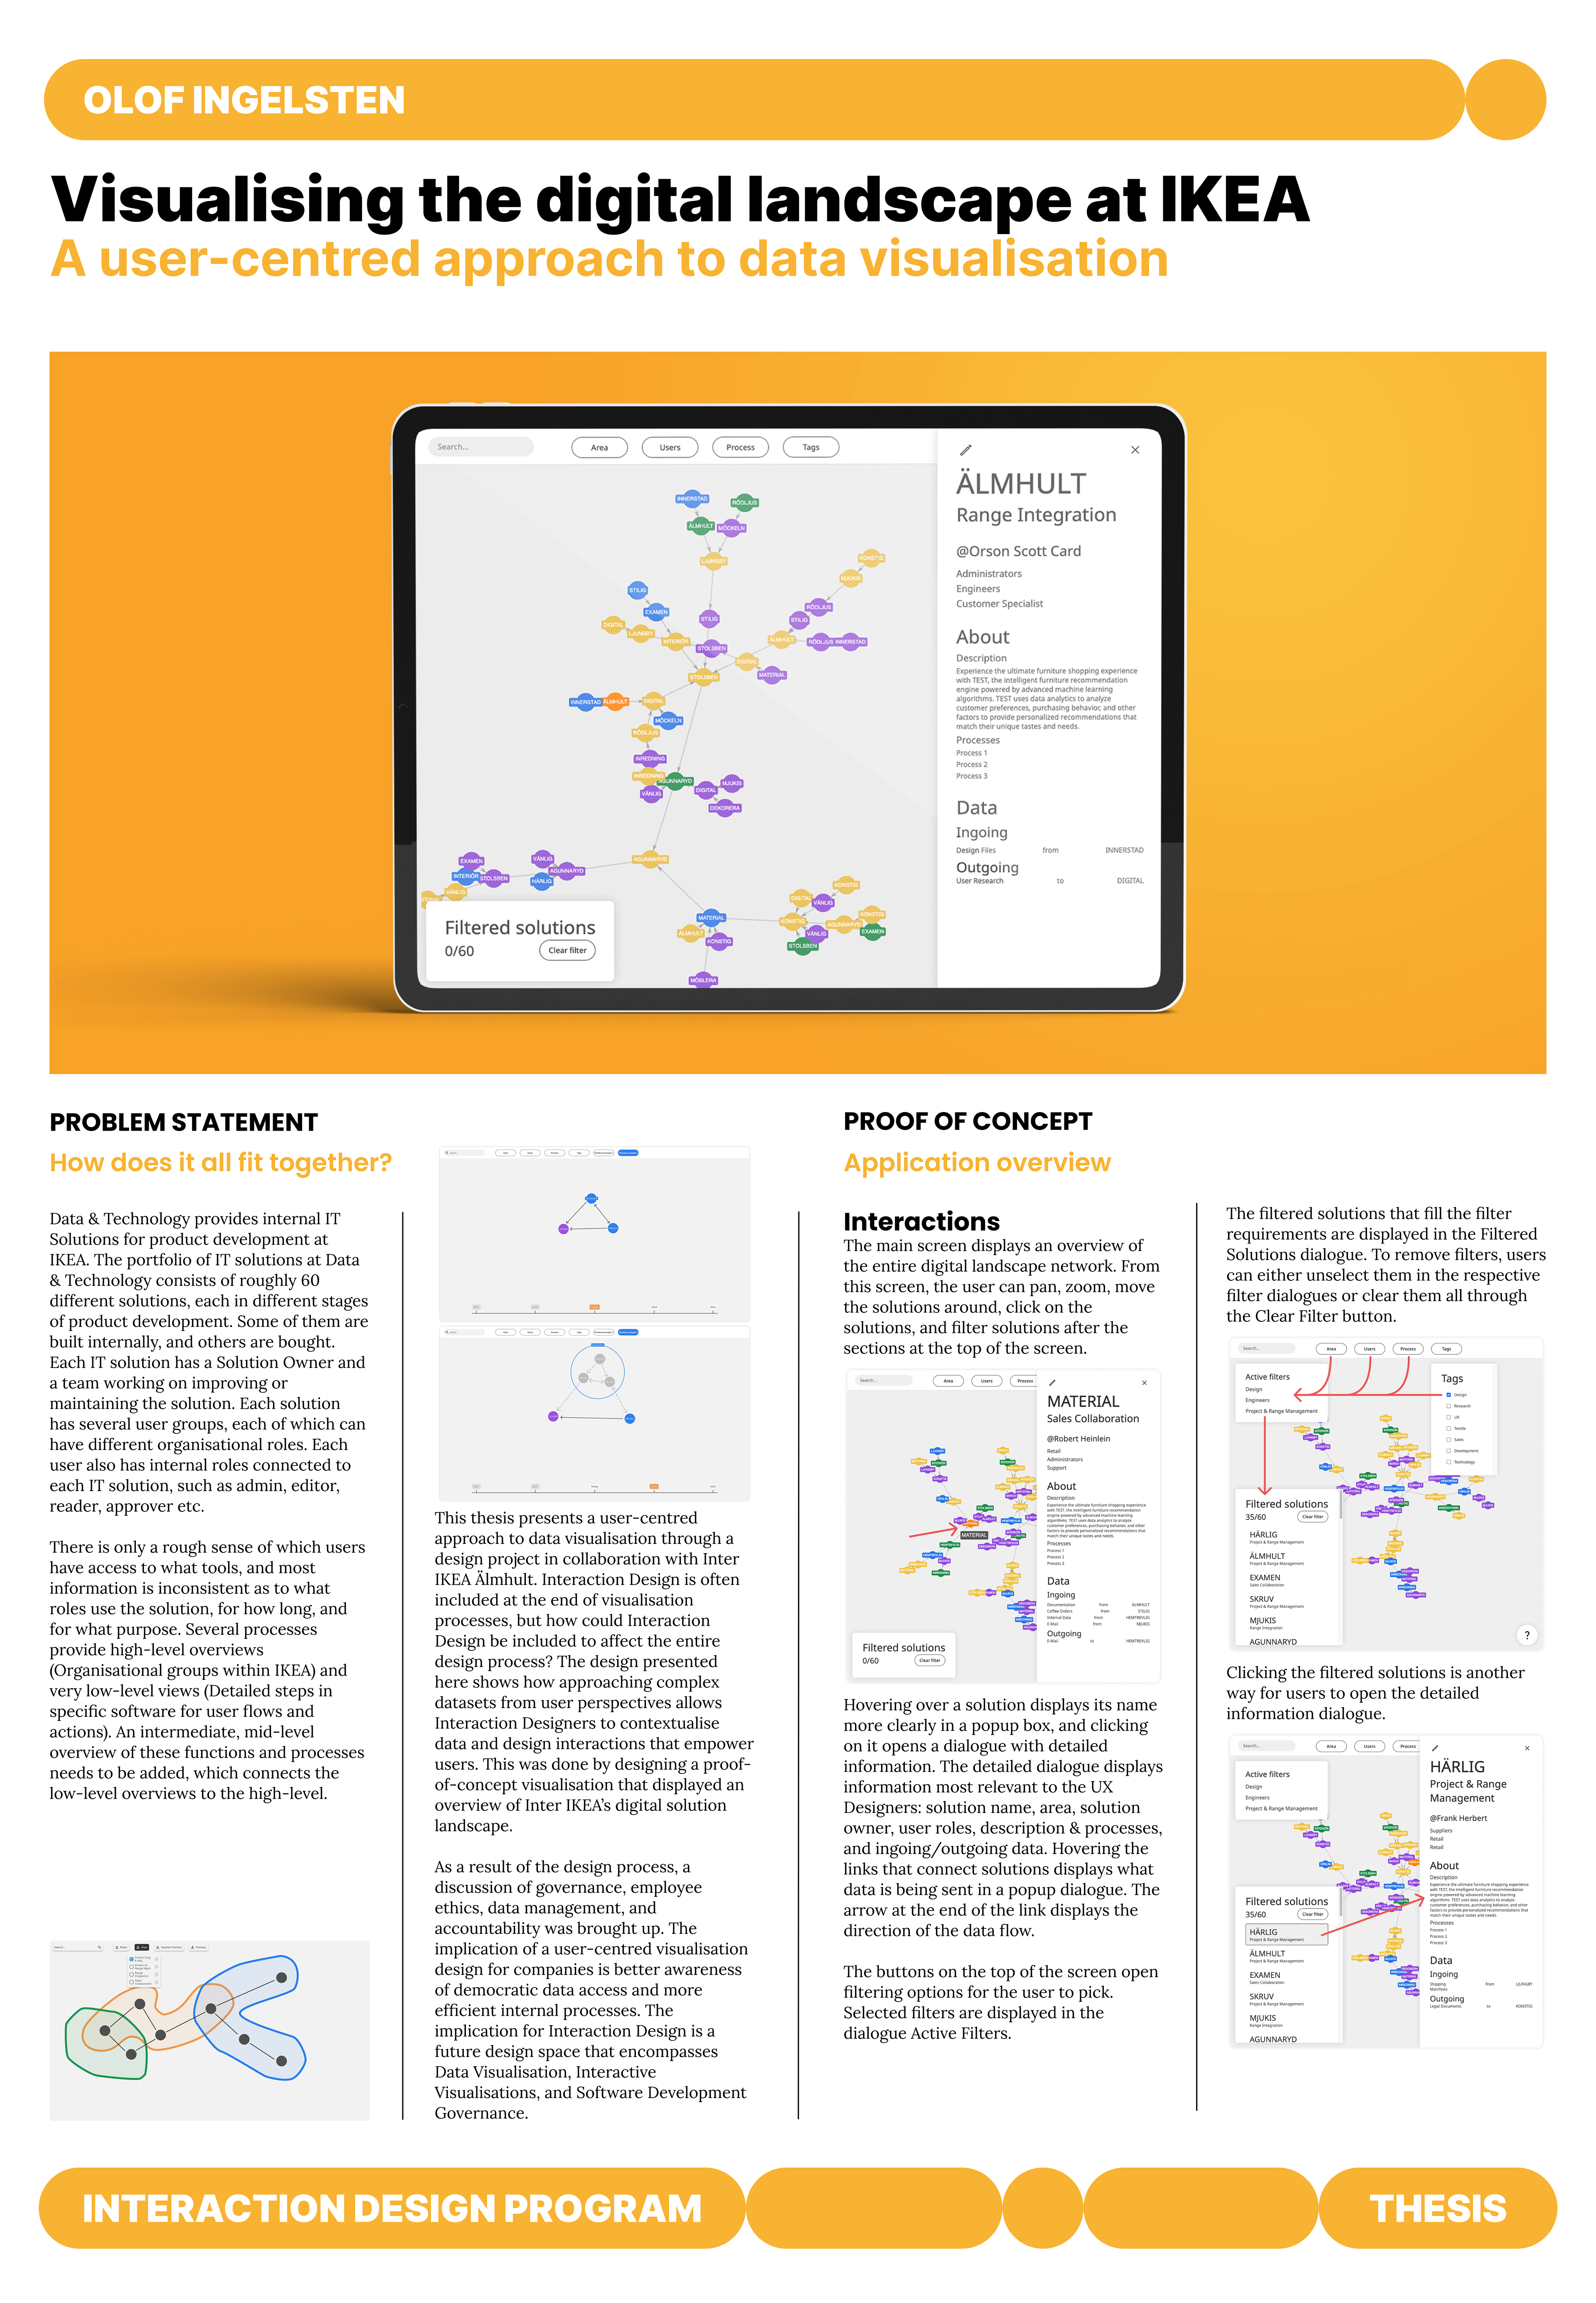
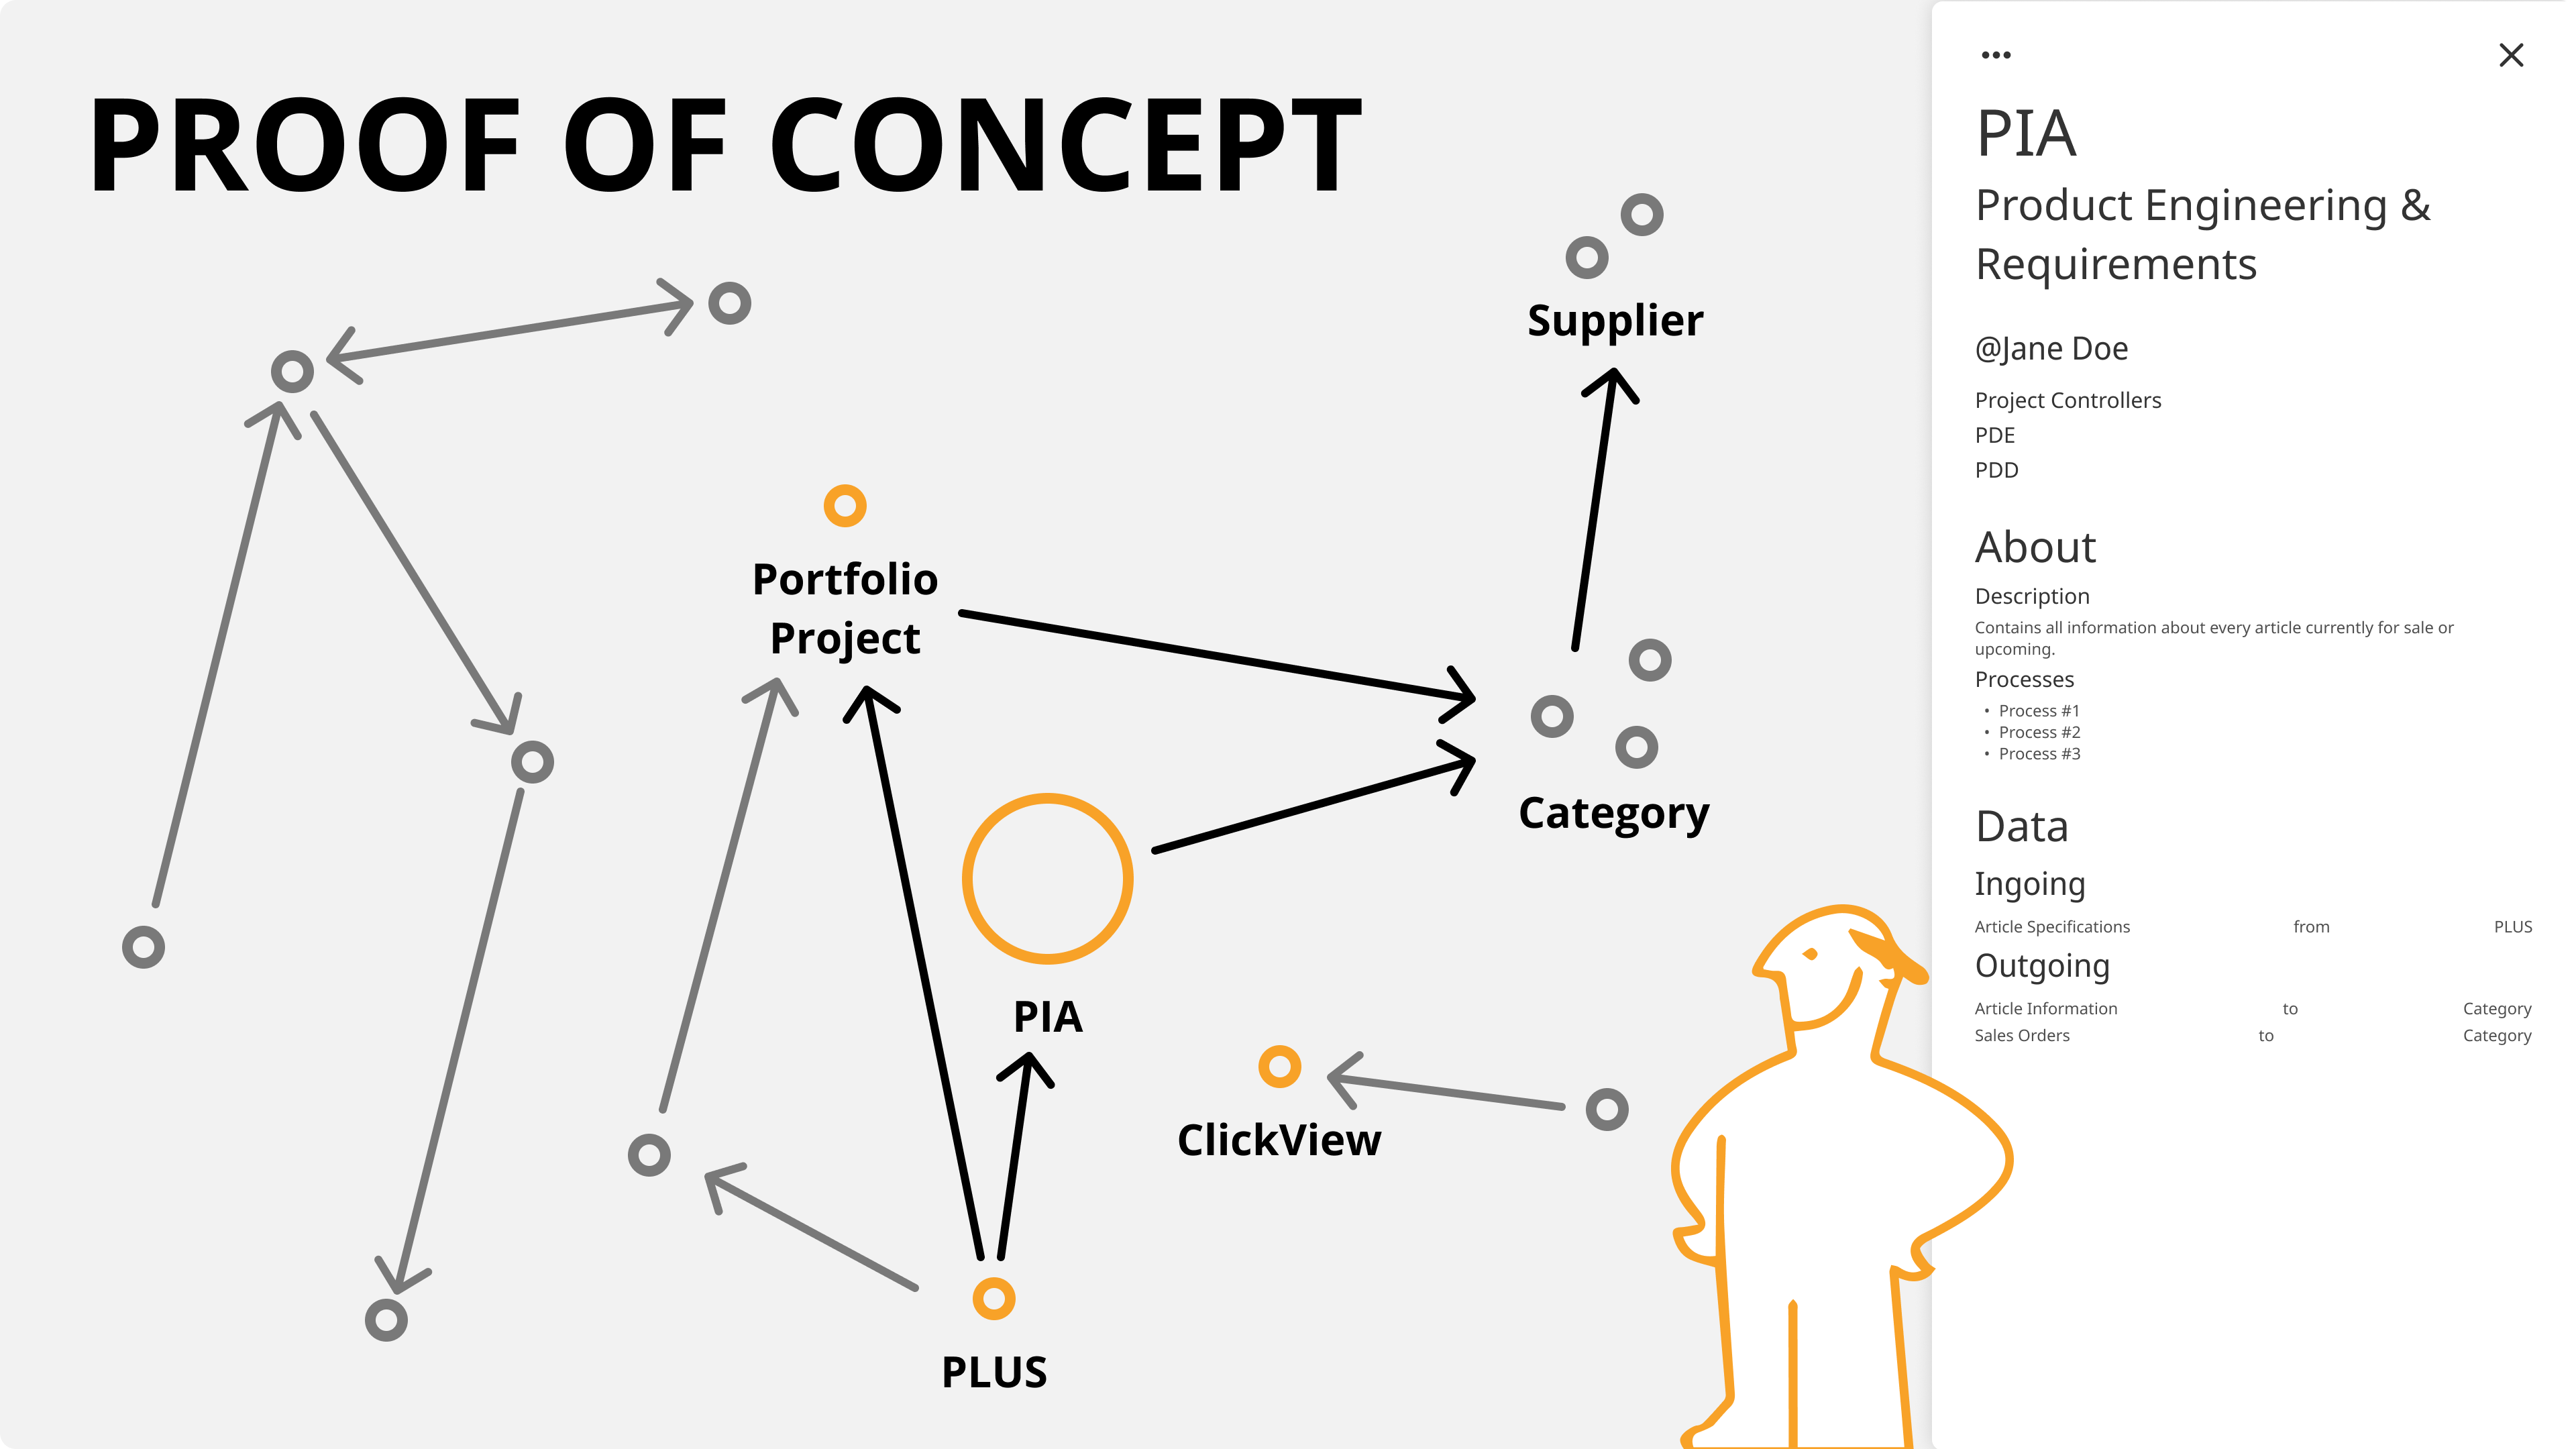
This thesis presents a user-centred approach to data visualisation through a design project in collaboration with Inter IKEA Älmhult. Interaction Design is often included at the end of visualisation processes, but how could Interaction Design be included to affect the entire design process? The design presented here shows how approaching complex datasets from user perspectives allows Interaction Designers to contextualise data and design interactions that empower users. This was done by designing a proof-of-concept visualisation that displayed an overview of Inter IKEA’s digital solution landscape.
As a result of the design process, a discussion of governance, employee ethics, data management, and accountability was brought up. The implication of a user-centred visualisation design for companies is better awareness of democratic data access and more efficient internal processes. The implication for Interaction Design is a future design space that encompasses Data Visualisation, Interactive Visualisations, and Software Development Governance.
Problem Statement
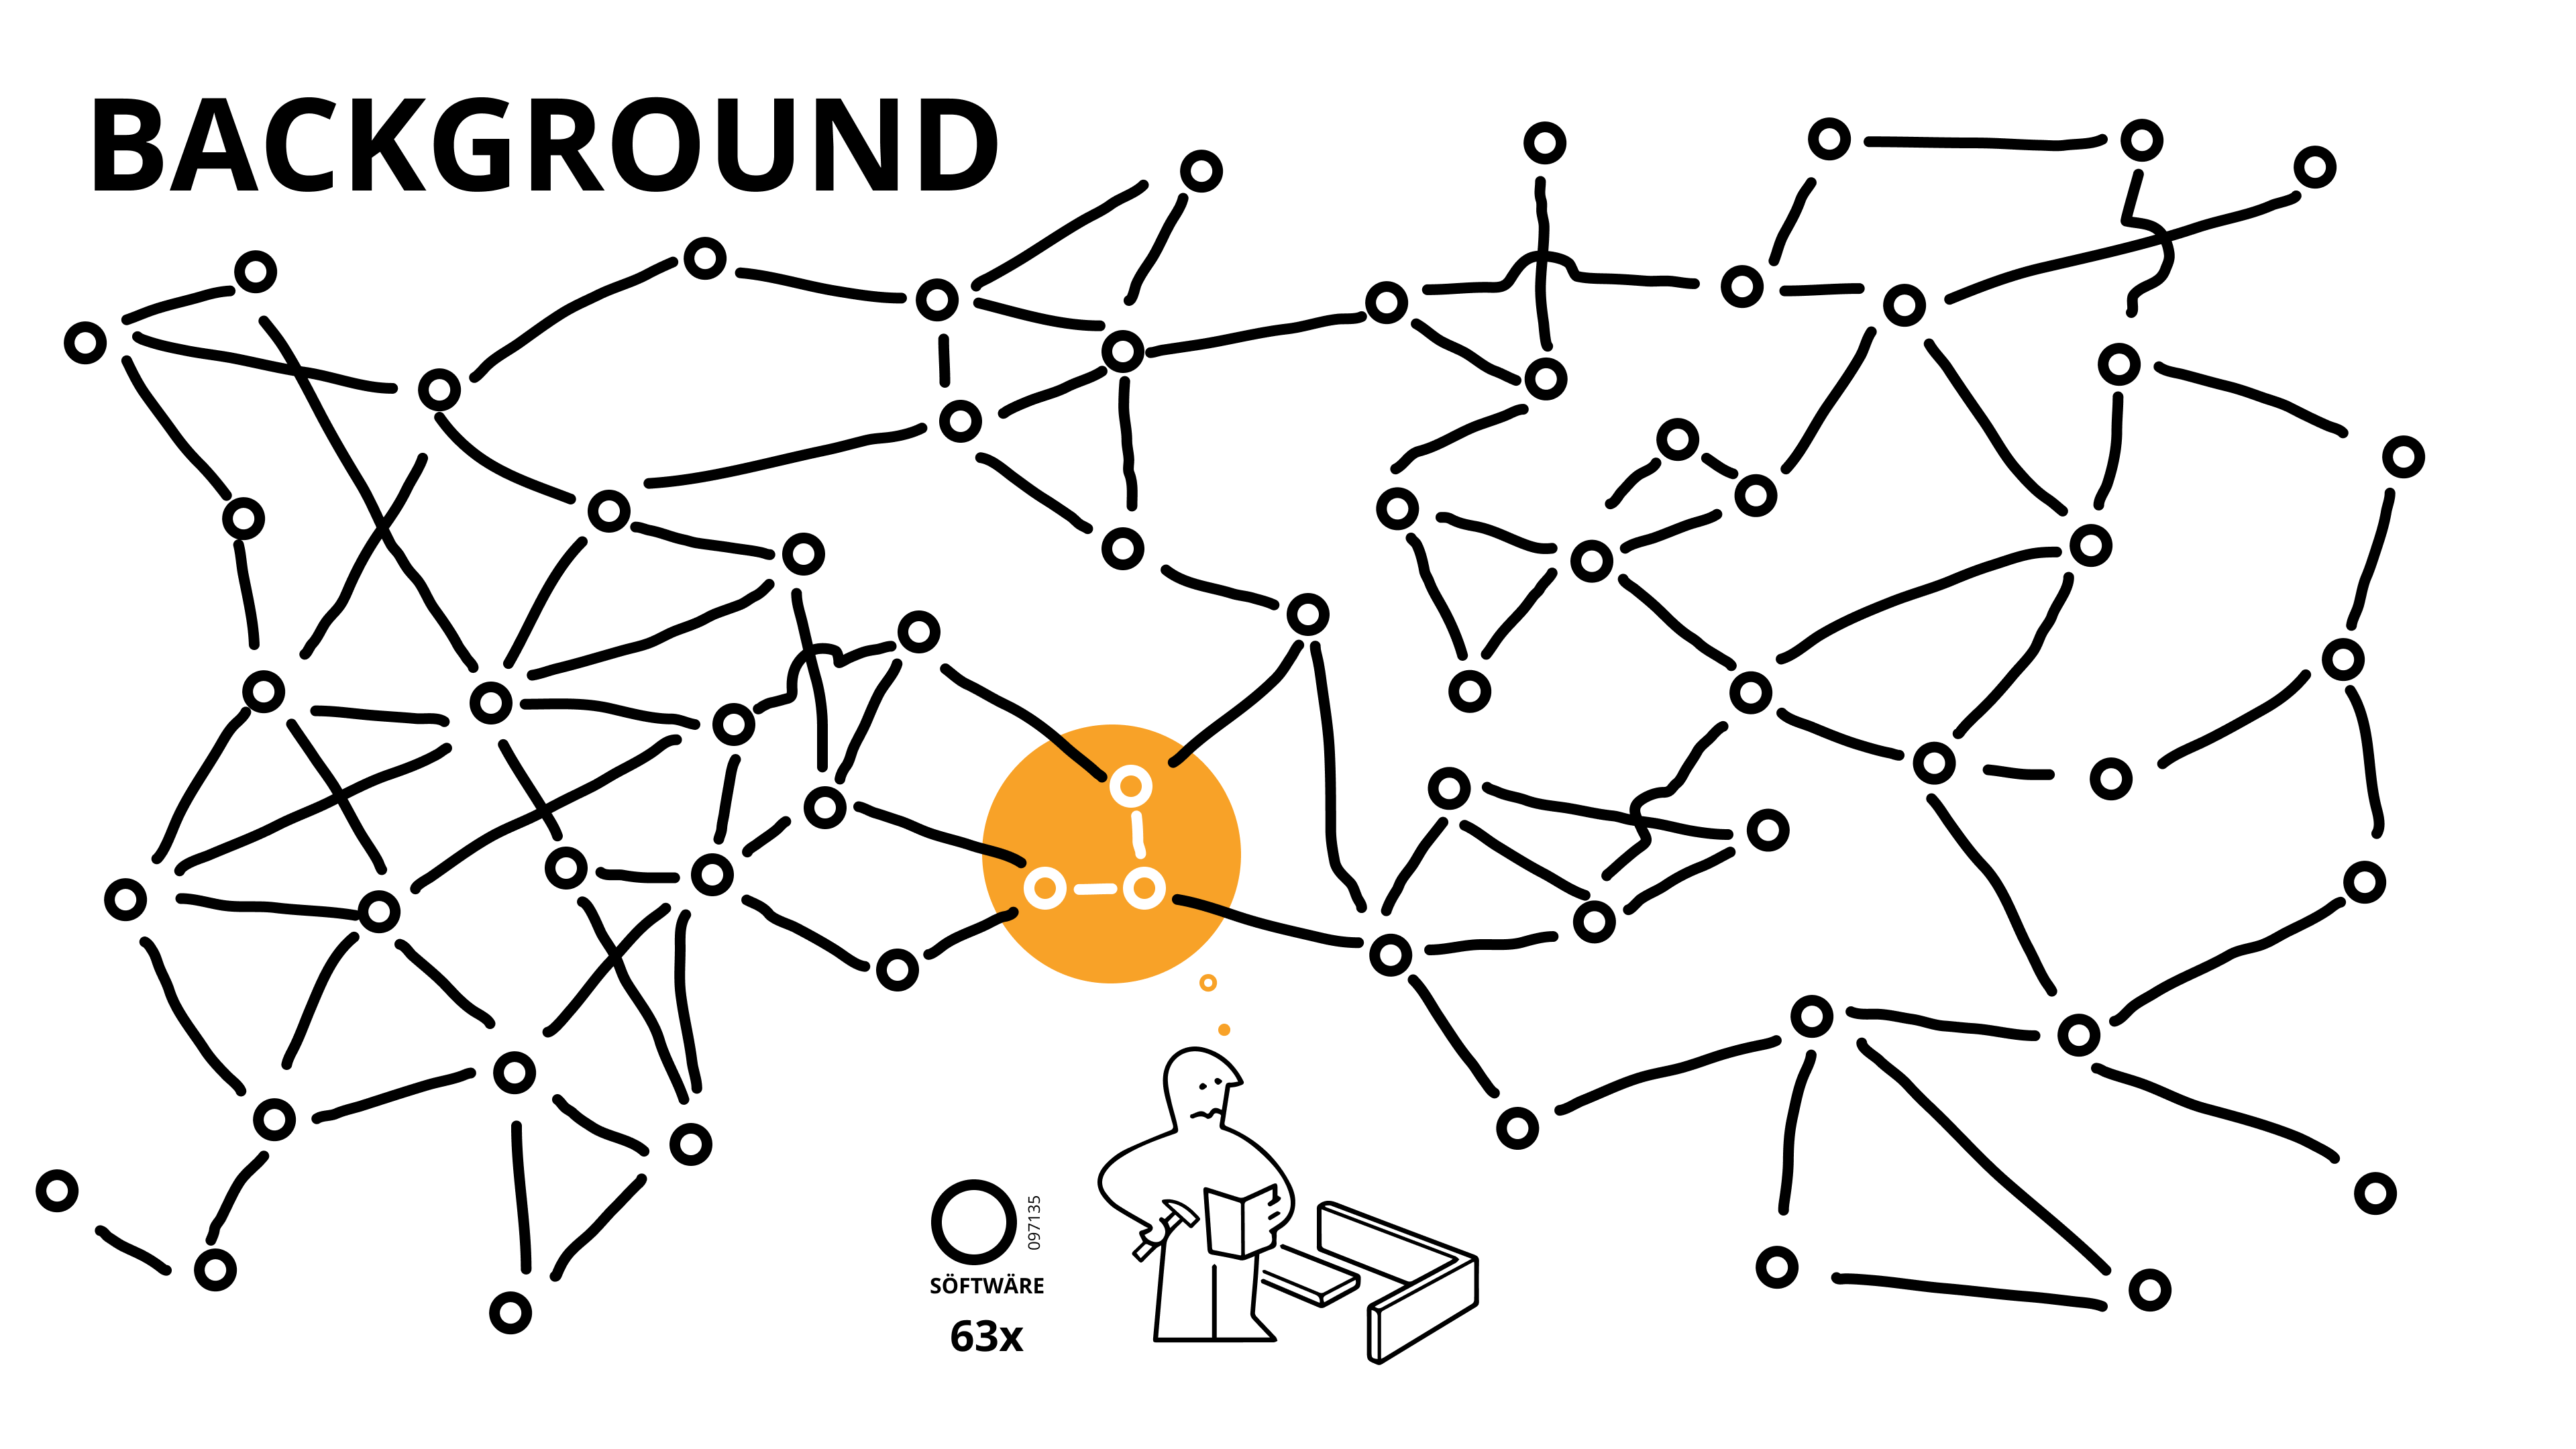
Data & Technology provides internal IT Solutions for product development at IKEA. The portfolio of IT solutions at Data & Technology consists of roughly 60 different solutions, each in different stages of product development. Some of them are built internally, and others are bought. Each IT solution has a Solution Owner and a team working on improving or maintaining the solution. Each solution has several user groups, each of which can have different organisational roles. Each user also has internal roles connected to each IT solution, such as admin, editor, reader, approver etc.
There is only a rough sense of which users have access to what tools, and most information is inconsistent as to what roles use the solution, for how long, and for what purpose. Several processes provide high-level overviews (Organisational groups within IKEA) and very low-level views (Detailed steps in specific software for user flows and actions). An intermediate, mid-level overview of these functions and processes needs to be added, which connects the low-level overviews to the high-level.
Conclusion and Future Work
I see opportunities for Interaction Designers and Visualisation Designers to work intersectionally to create better user experiences in data visualisation. Further research could be conducted on creating dynamic visualisations that empower people who are not data analysts to build and visualise complex data. On top of that, more research could be conducted on the effects of using a user-centred approach to data accessibility and SDG. Lastly, further material explorations could be made to analyse existing visualisation solutions and to explore the design space from an Interaction Design perspective.
From the perspective of IKEA, this thesis is a starting point for a discussion regarding the future of the digital landscape and how it could evolve.
This thesis has presented a user-centred approach to data visualisation from an Interaction Design perspective. This has been done through analysing related visualisation solutions, related scholarly works, and user research at Inter IKEA. The research resulted in a proof-of-concept design that visualised the digital solution landscape from a UX perspective providing users with a better understanding of the context in which they are working.
Key learnings from this design process can be summarised as follows:
1. Understanding user needs and contextualising data accordingly is critical for a good user experience.
2. The actual visualisation method comes second to user needs and should be designed based on those needs.
2. The actual visualisation method comes second to user needs and should be designed based on those needs.
3. The ethical implications of a user-centred visualisation can empower users and promote equality.
4. The process of designing a user-centred visualisation can uncover issues larger than the visualisation itself.
4. The process of designing a user-centred visualisation can uncover issues larger than the visualisation itself.
Proof of Concept
To try the publically available prototype, click the button below. The video below shows the final Proof of Concept and previous prototype iterations, and Figma prototypes.
Images
Implementation prototype
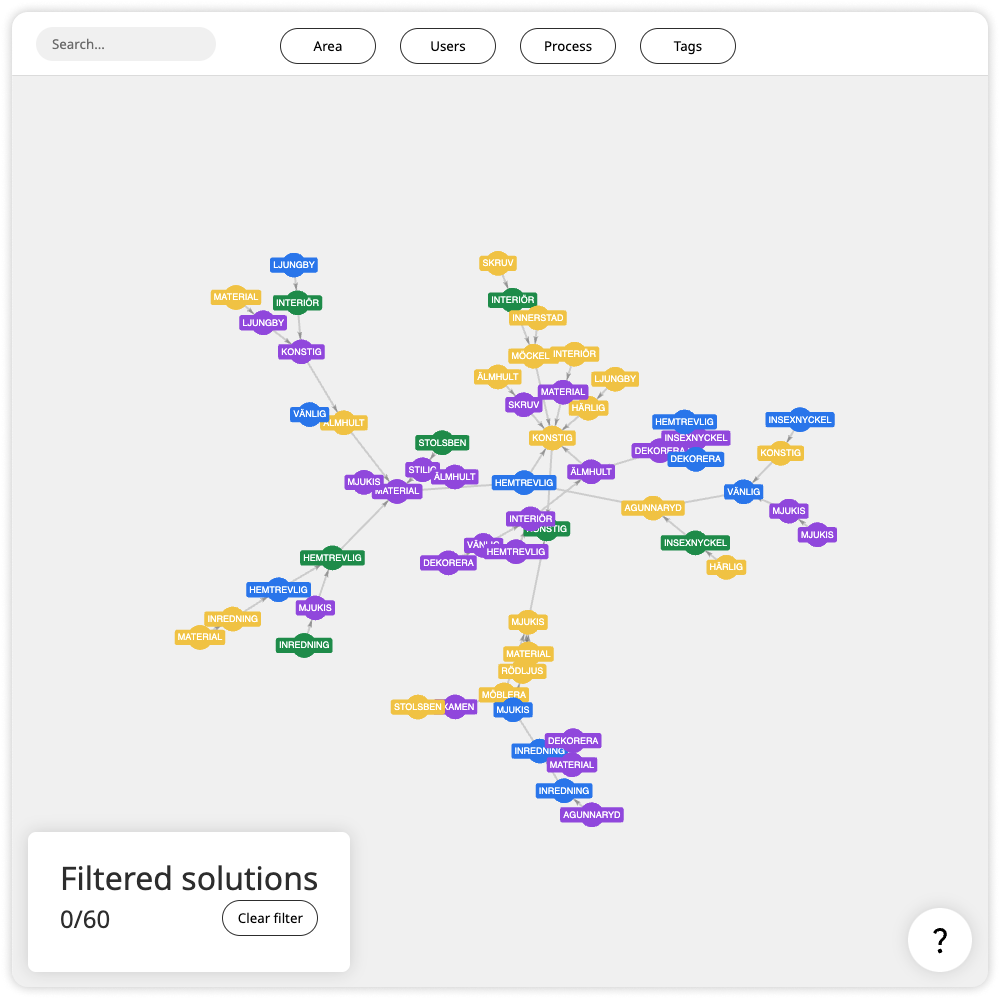
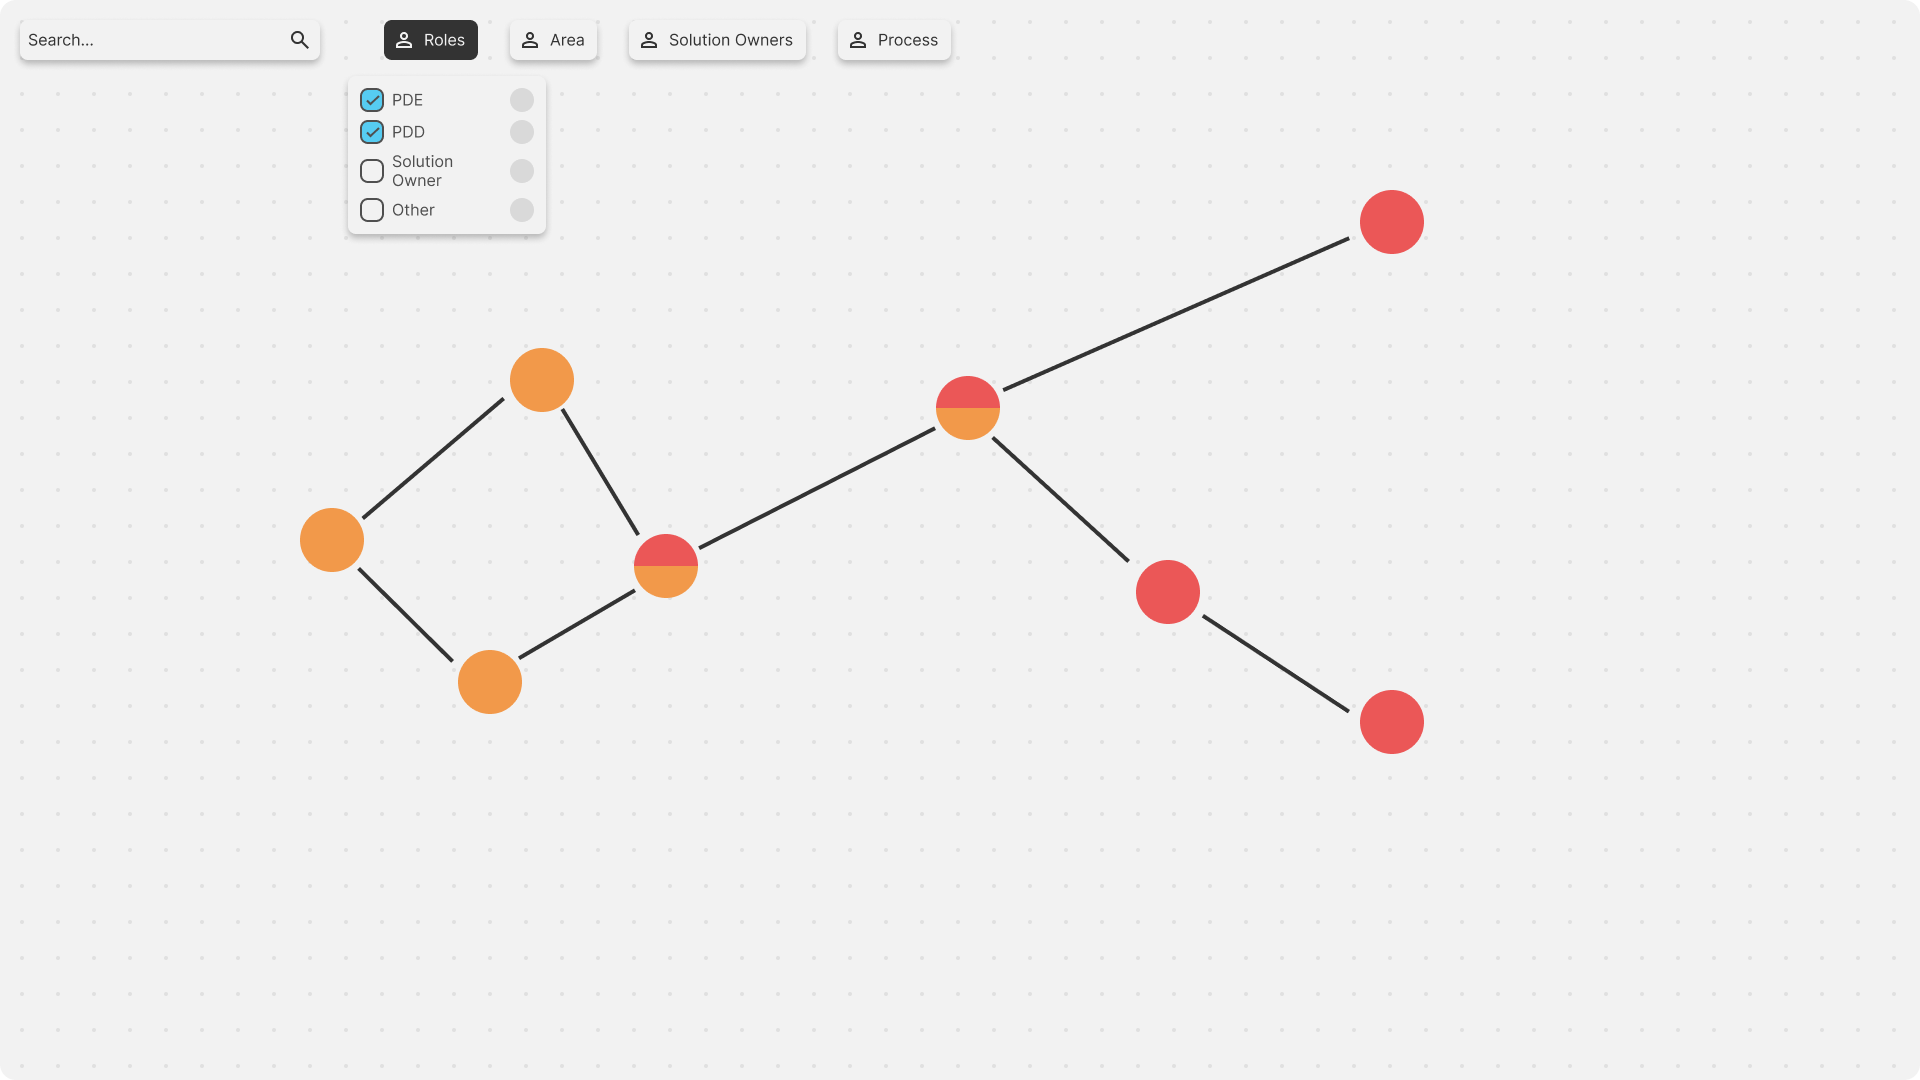
Main overview
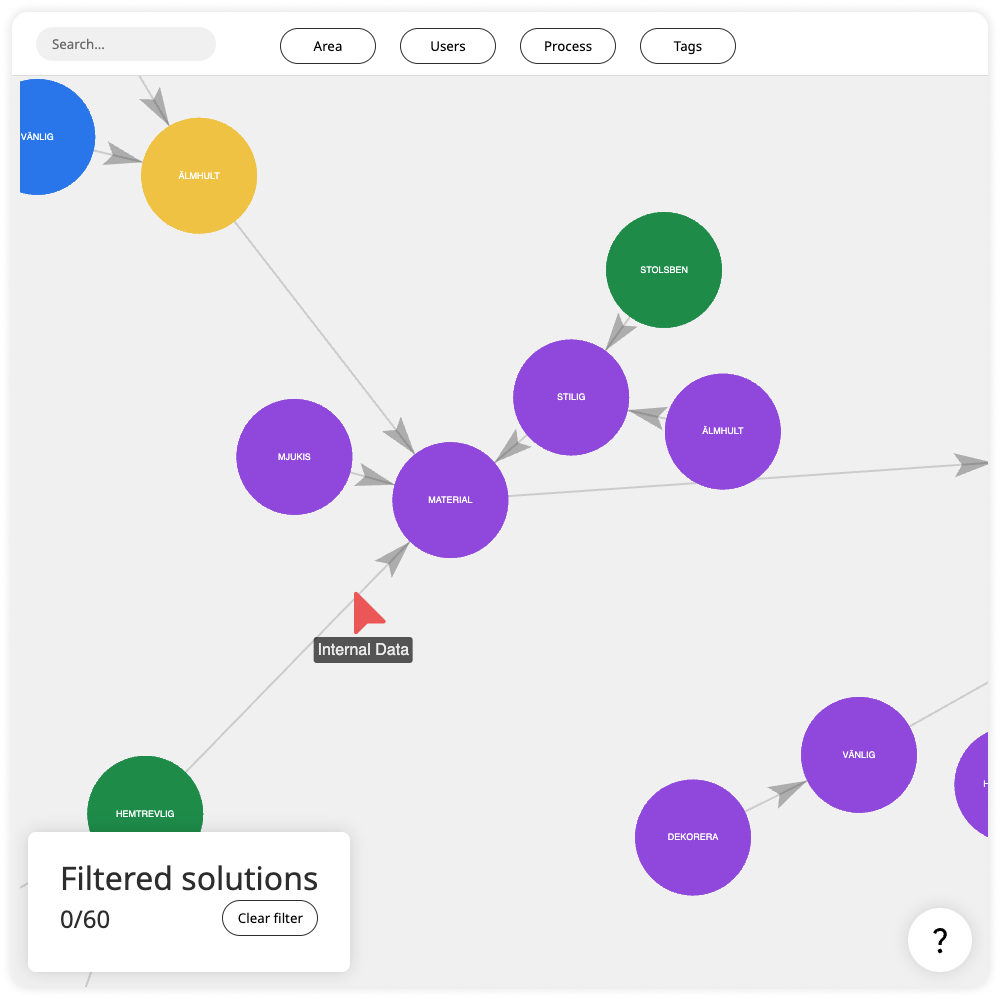
Hovering links
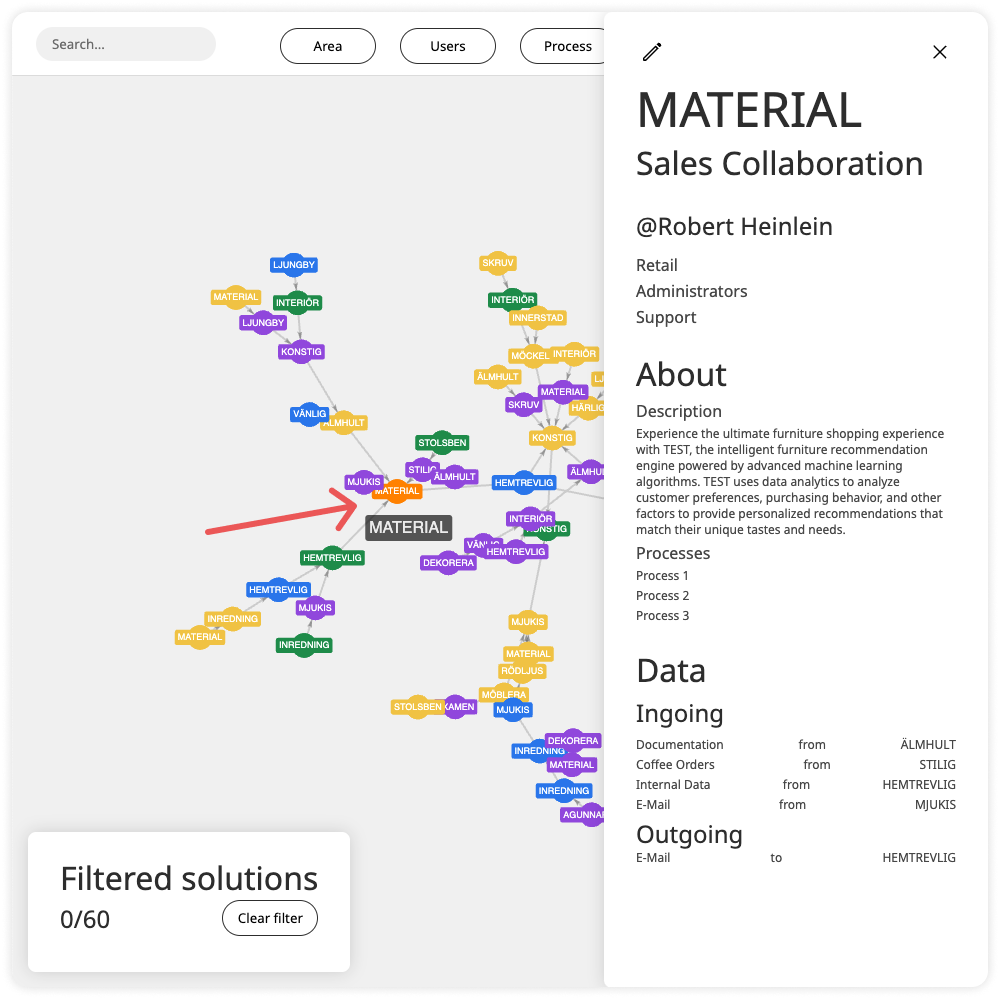
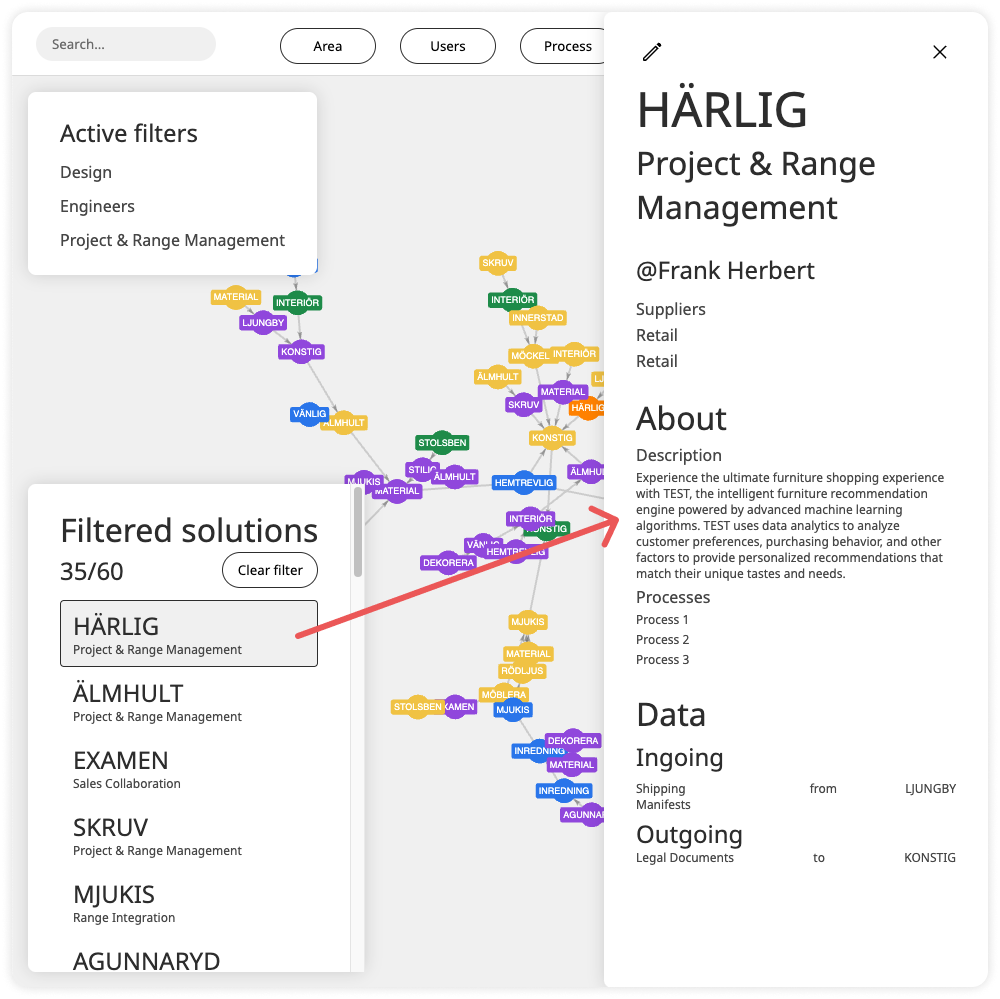
Detailed dialogue
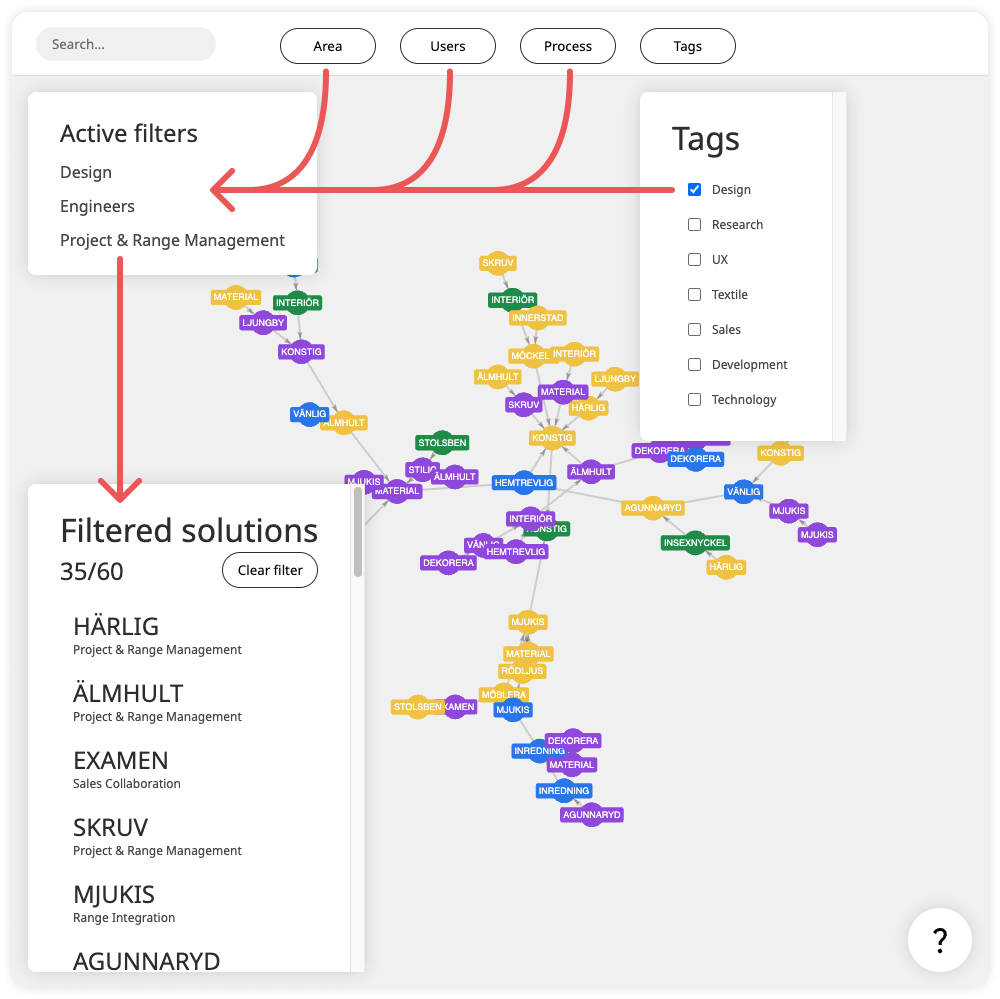
Filtering solutions
Other means of interaction
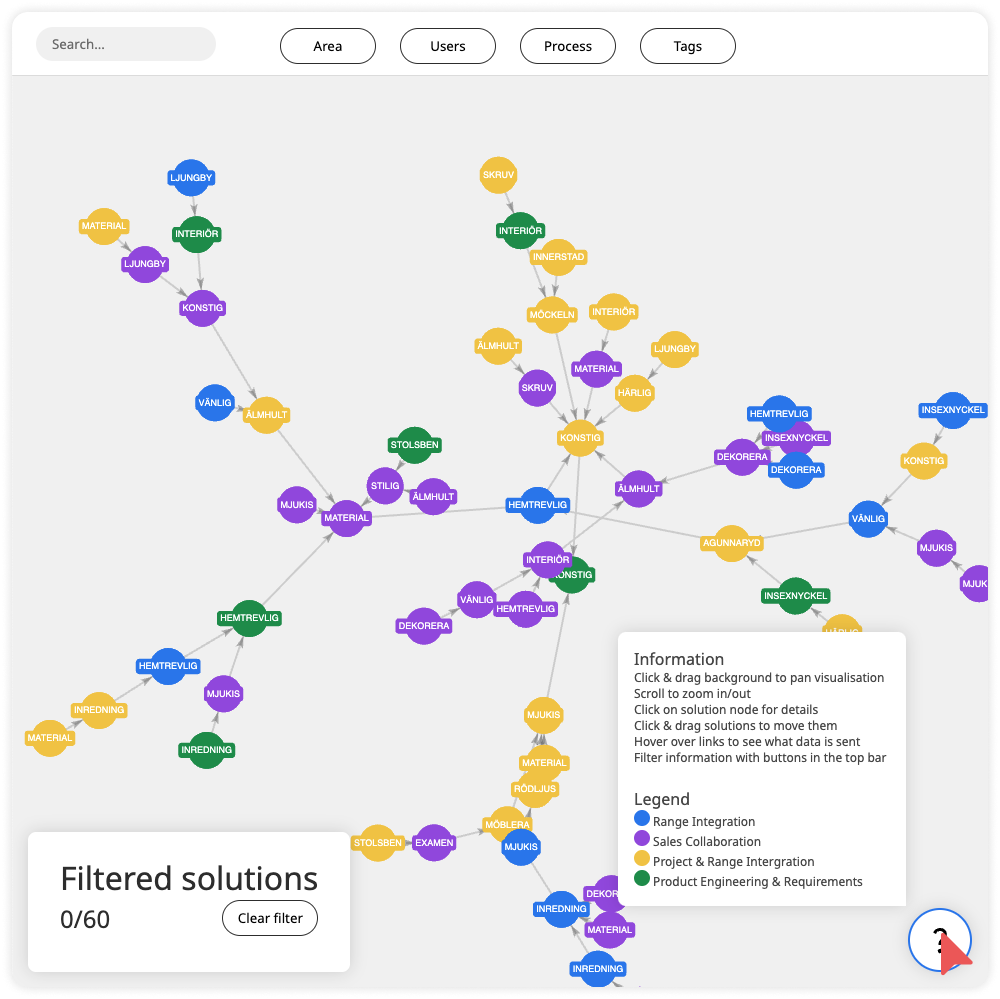
Information popup
Figma prototypes
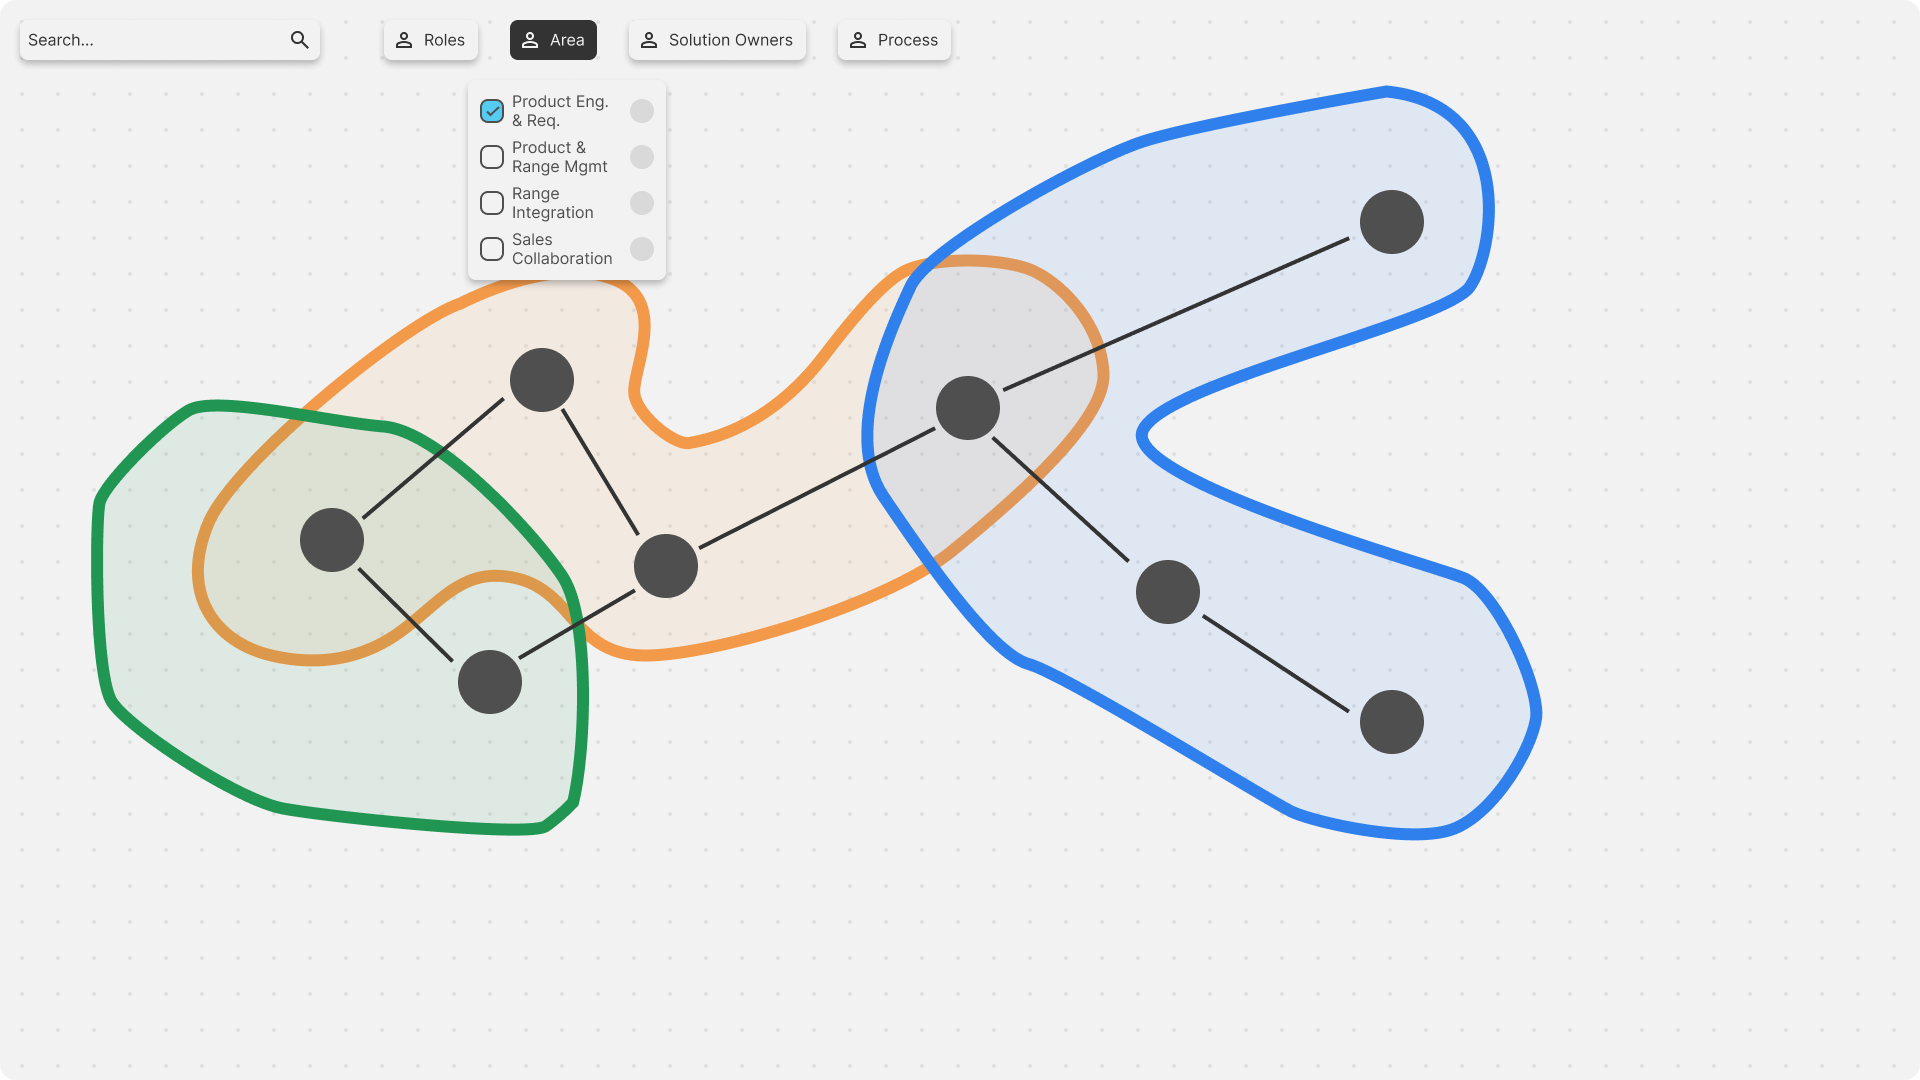
Display area
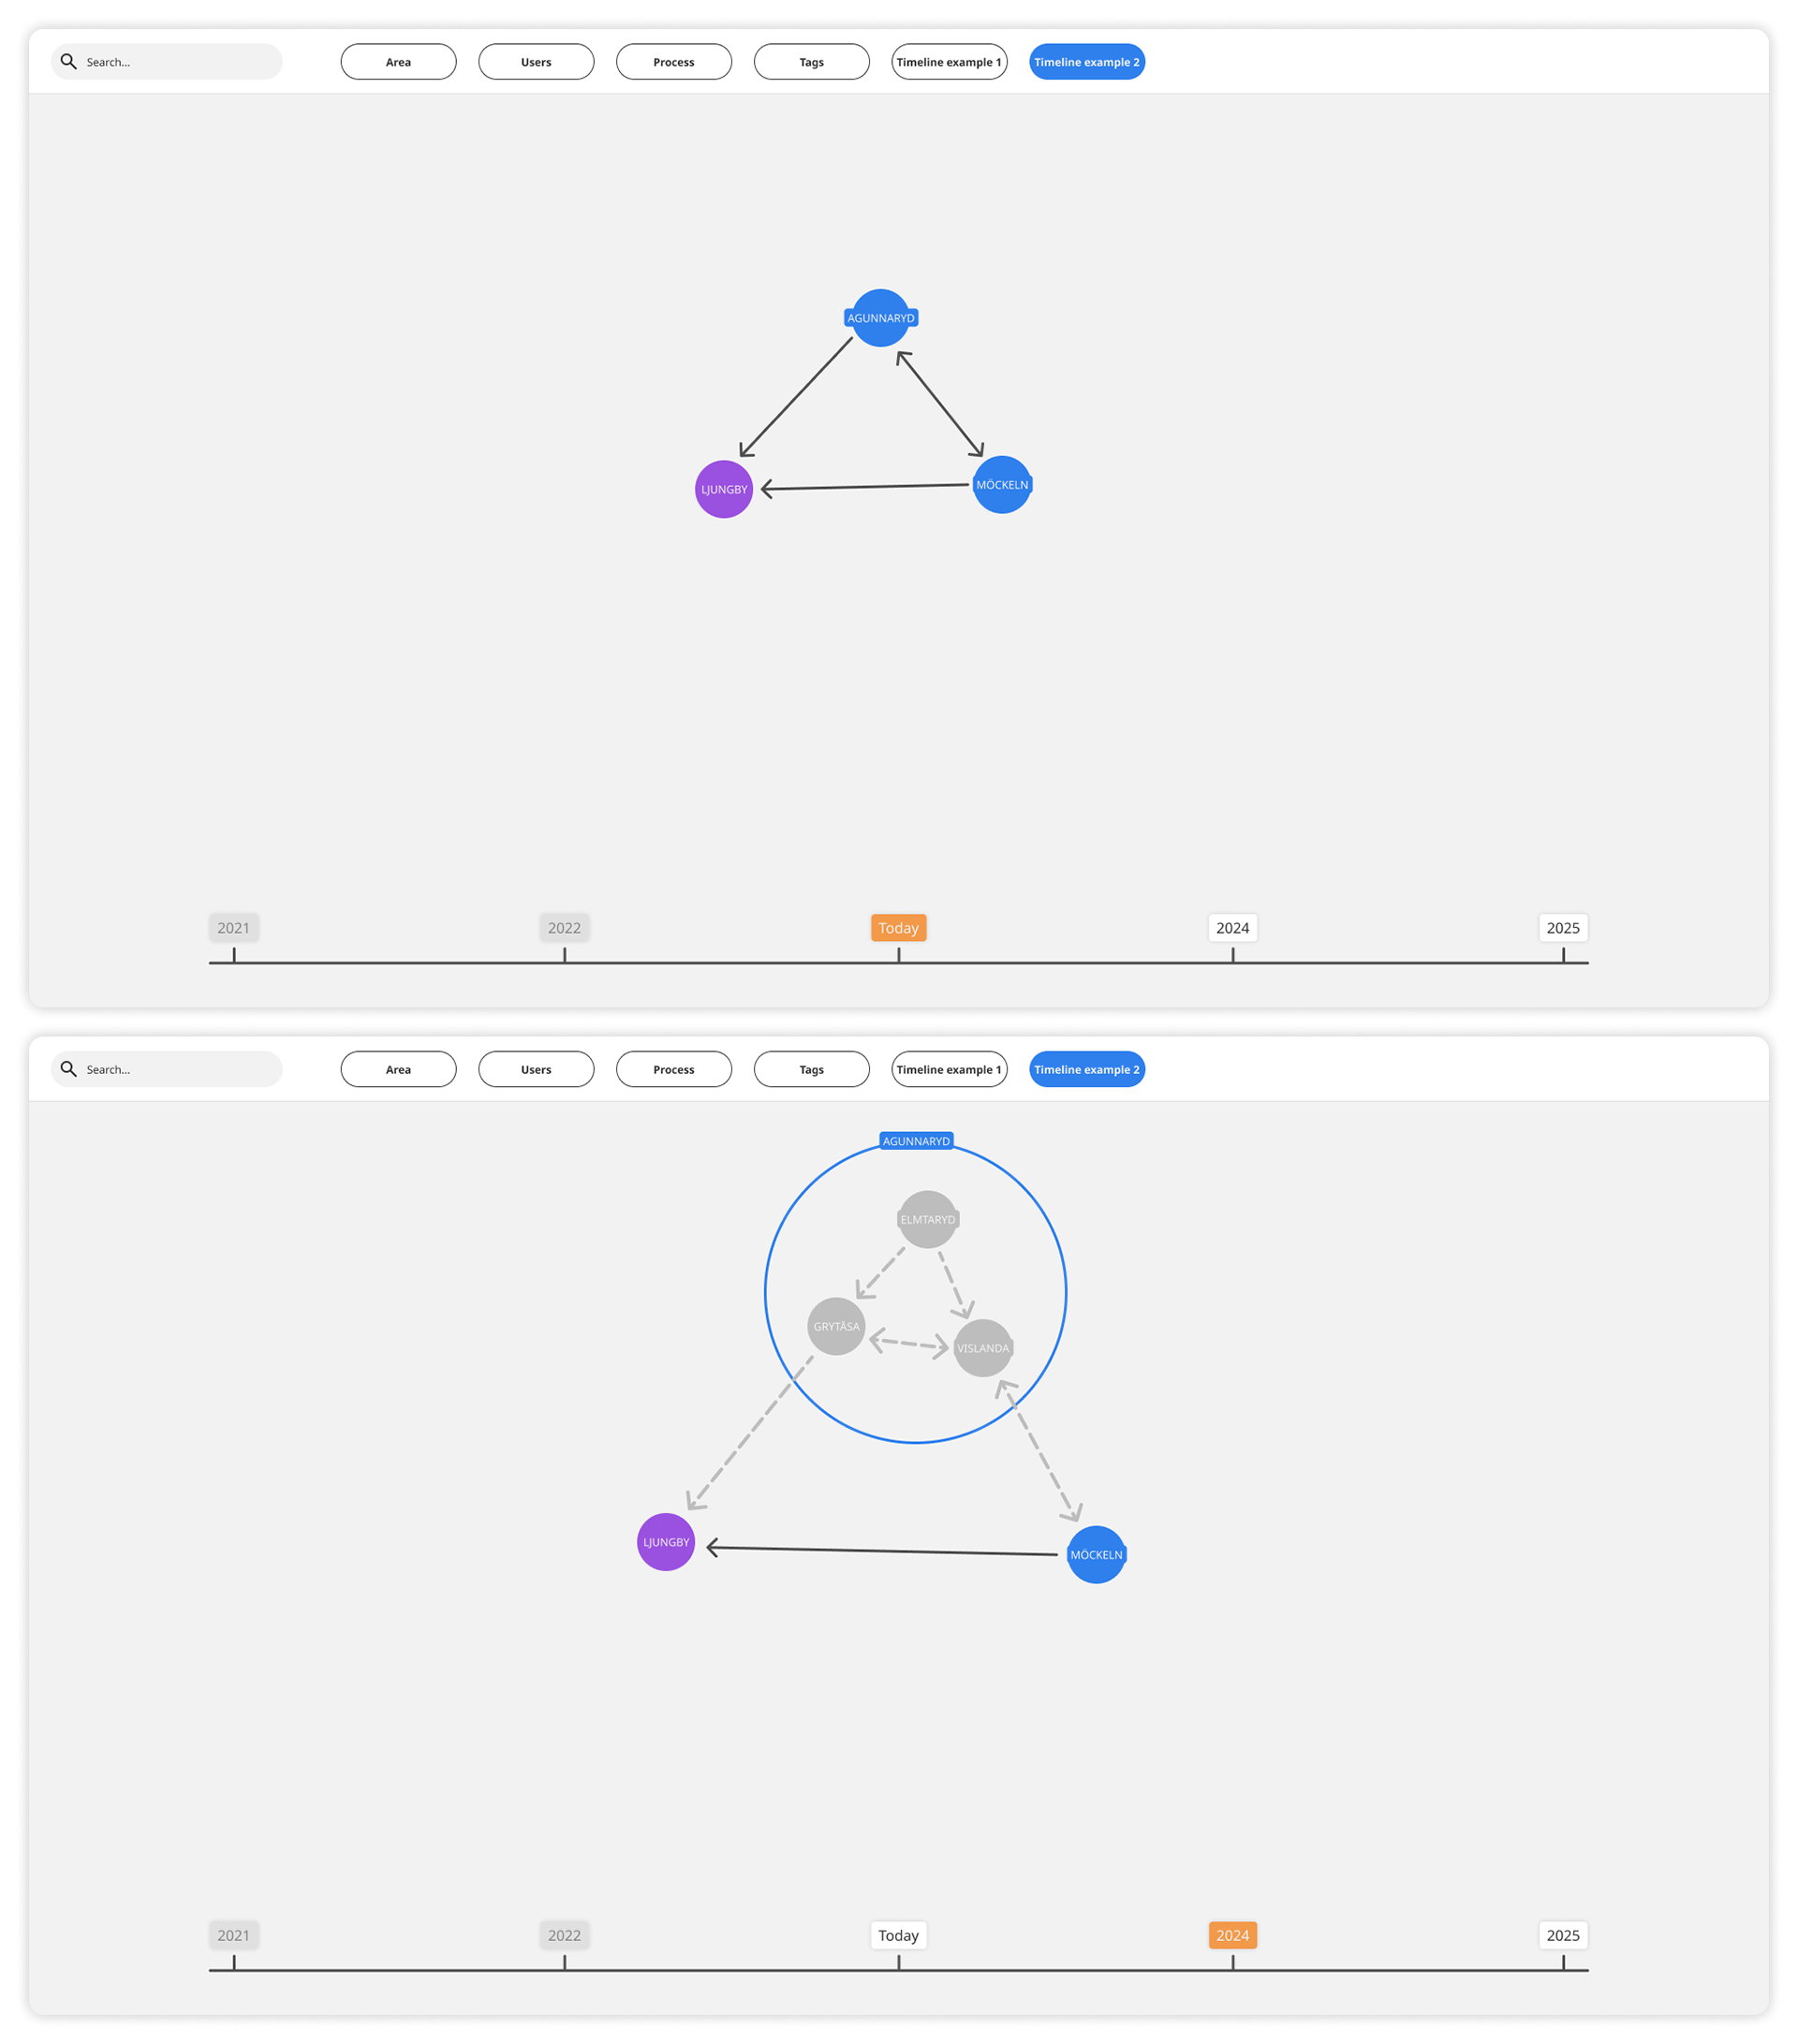
Future solution timeline
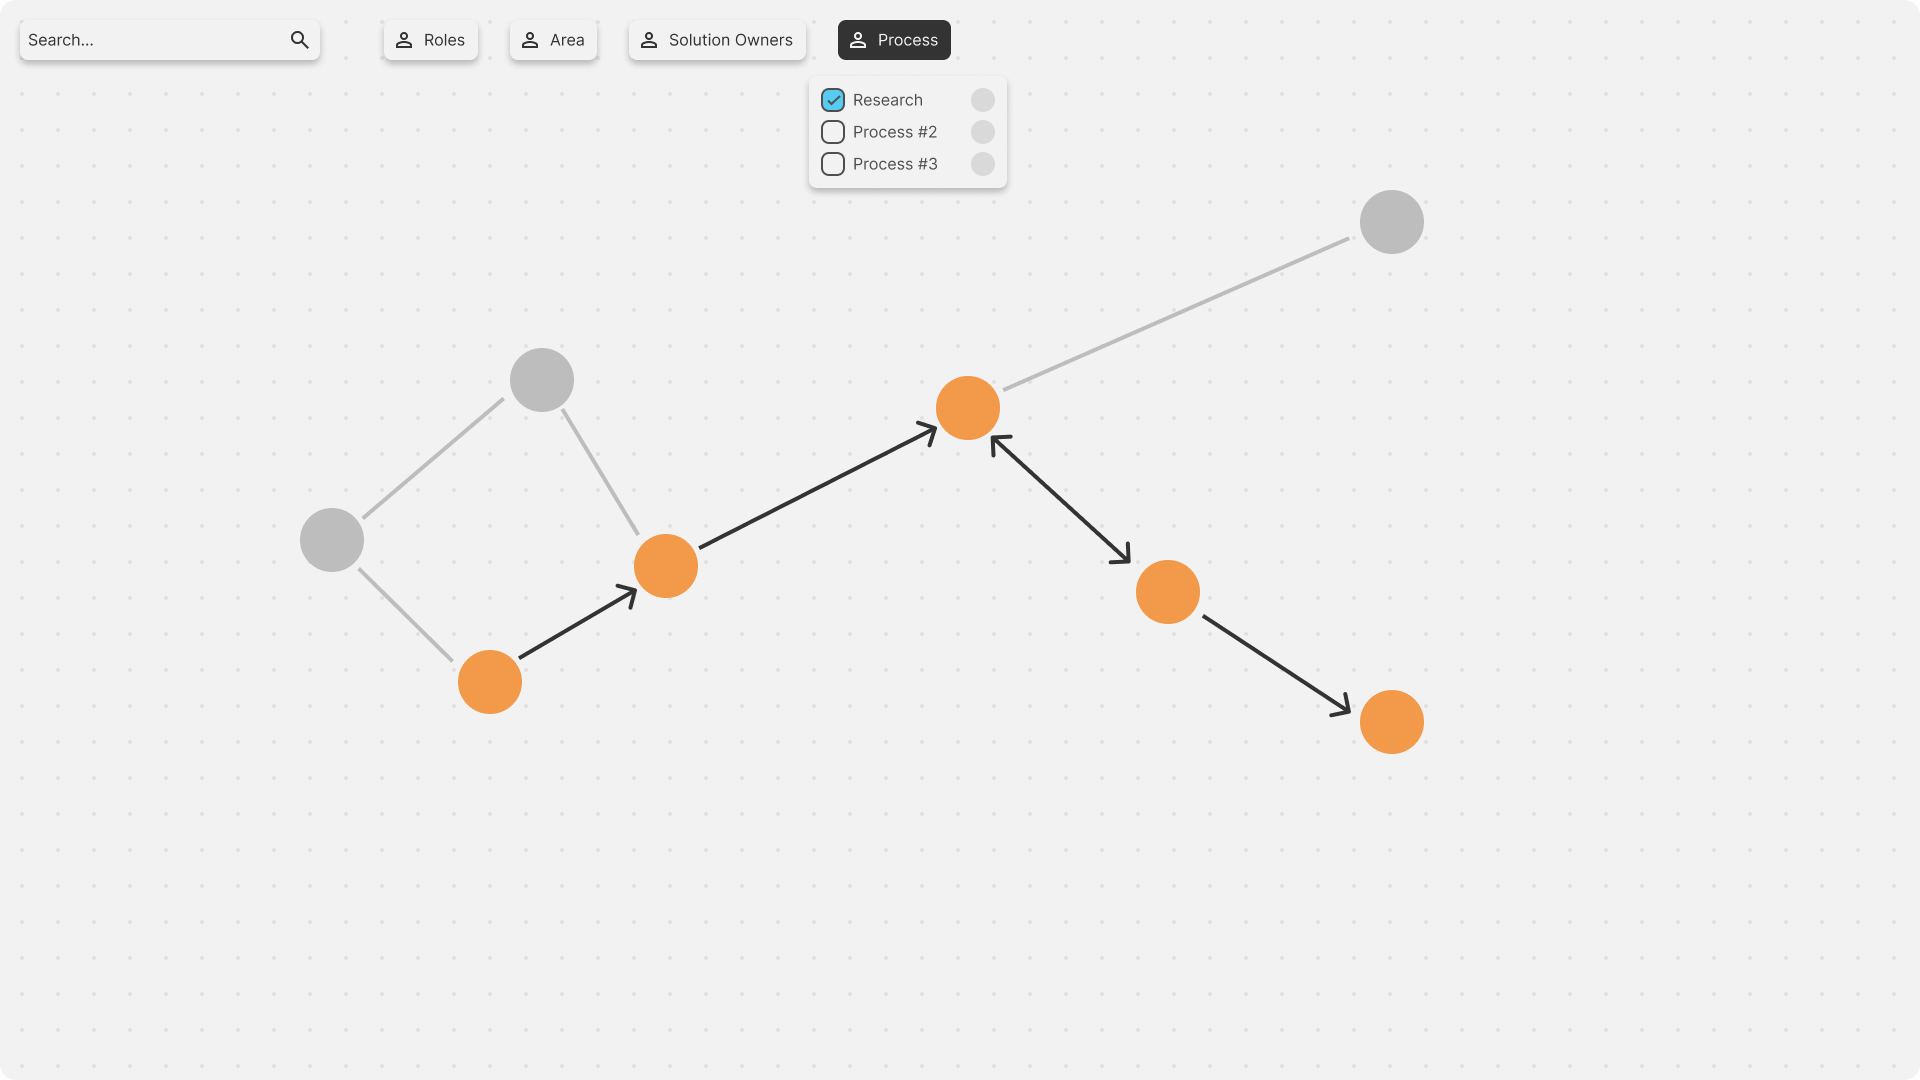
Filter specific processes
Filter user groups within solutions
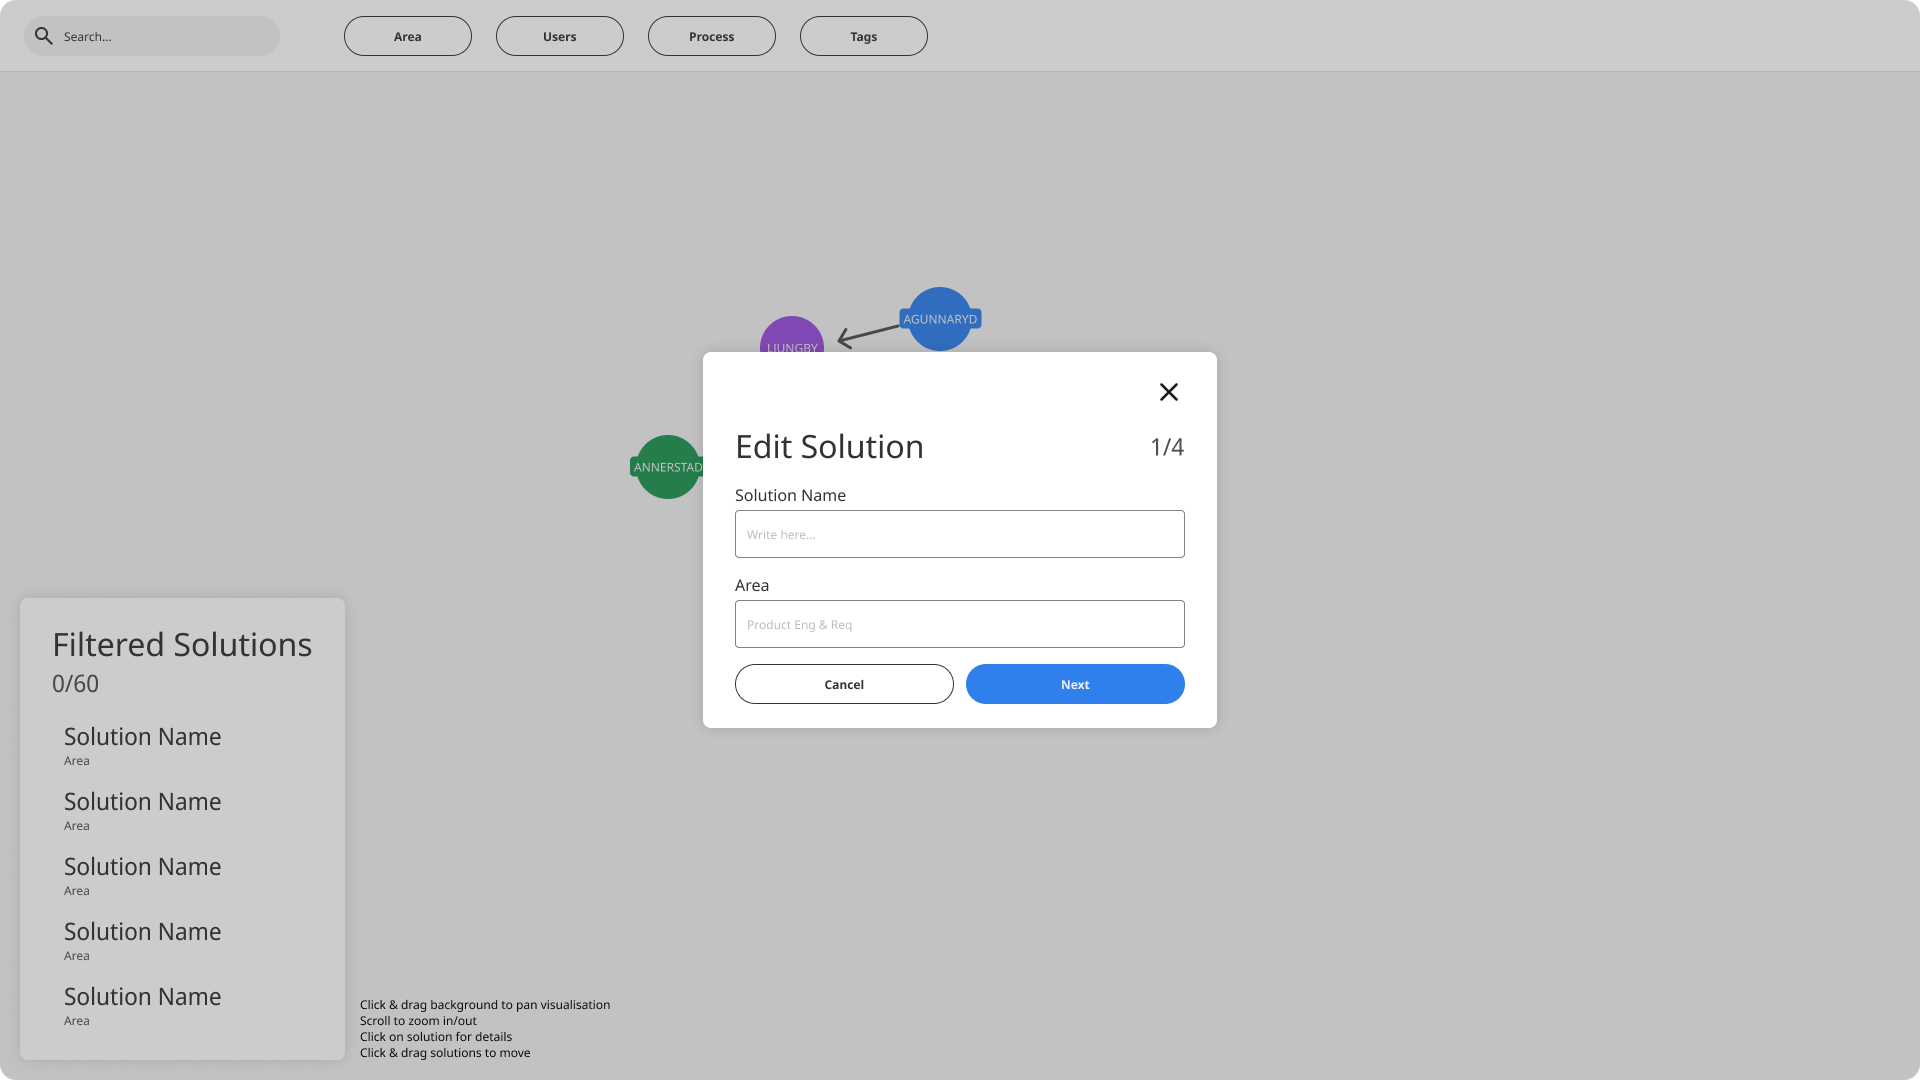
Manually edit and update solutions
Exhibition Poster